Derisking Clean Electricity Investments in LMICs: Strategy Report
Summary
- Why is derisking clean electricity in LMICs important?
Derisking refers to lowering the barriers—financial, regulatory, and structural—that hinder investment in clean electricity in low- and middle-income countries (LMICs). LMIC electricity generation, excluding China, emitted roughly 4.1 billion tons of CO2 in 2025, or about 29% of global power sector emissions. Under current policies, LMIC generation is projected to double by 2050 due to growing populations, expanding electricity access, and further industrialization.
We estimate the mitigation potential of LMIC electricity grids, which is the difference in emissions between a business-as-usual and mitigation scenario, will be approximately 6.4 billion tons of CO2-equivalent (CO2e) in 2050, or 10% of global emissions. LMICs are on track to become a larger share of the world’s electricity emissions, meaning choices taken now will influence how future demand is met and the trajectory of future emissions.
- How could efforts to derisk clean electricity in LMICs reduce greenhouse gases?
Most LMICs are expected to experience significant growth in energy demand. Clean electricity projects, especially when designed to produce baseload power, can be more capital-intensive than fossil fuel projects, which makes access to finance a critical lever for decarbonization. As it stands, high investor-perceived risk and grid infrastructure constraints hold back the development of clean electricity resources in many LMIC markets. If LMICs lowered risks in their electricity markets, clean electricity resources could meet a greater portion of new energy demand—avoiding the buildout of new fossil fuel generators, and even replacing existing ones.
- What do our findings suggest are the most promising philanthropic sub-strategies for reducing electricity emissions?
Based on our evaluation of scale, feasibility, and funding need, we think the most promising philanthropic sub-strategies to derisk clean electricity in LMICs are:
- Developing and aggregating knowledge to improve regional capacity
- Creating strong aggregated project pipelines
- Improving utility operations
- Implementing grid planning and reliability best practices
All four sub-strategies will support the development of stronger and more resilient electricity markets and regulatory environments that are necessary to lower investment risk and attract more financing toward clean electricity in LMICs.
- Is there room for more funding?
After reviewing financial records of 24 foundations active in this space, we estimate that efforts to derisk clean electricity in LMICs receive $39 million USD in philanthropic funding per year, equivalent to 4% of all foundation funding for climate change mitigation in LMICs.
Total climate investment from the private and public sectors for clean electricity in LMICs totals roughly $380 billion per year, 29% of the estimated $1.3 trillion per year needed by 2035.
Based on this funding data, we think efforts to derisk clean electricity in LMICs are severely underfunded.
- Are there major co-benefits or potential risks?
Derisking clean electricity investments in LMICs includes co-benefits such as expanded electricity access, improved electricity reliability, higher economic productivity, and greater short-term energy security. At the same time, this strategy could raise electricity prices for consumers who can least afford them, and displace jobs and public revenue in countries with large fossil fuel industries. We think careful planning and implementation can mitigate these risks.
- What are the key uncertainties and open questions?
Our key uncertainties include how much LMIC electricity demand and emissions will grow by 2050, the extent to which the sub-strategies we prioritize will lower risk for fossil fuel investment alongside clean electricity, and which regions and countries offer the most effective entry points for each sub-strategy. We are also uncertain how growing investment from countries such as China, and energy security concerns following recent geopolitical conflicts, will influence LMIC decisions to adopt clean electricity generators.
- What is the bottom line, and what are the next steps?
Electricity demand in LMICs is expected to grow substantially in the coming decades, and high levels of risk are preventing finance from reaching clean electricity projects. We think philanthropy is well positioned to address the barriers that drive that risk, and that the sub-strategies we prioritize are underfunded relative to the size of the problem.
Given the projected growth in LMIC electricity emissions, the low level of philanthropic funding these sub-strategies receive, and the declining support from high-income country governments, we think it is important to direct more philanthropic funding toward derisking clean electricity investments in LMICs.
We recommend that philanthropists consider funding organizations that are working to address the challenges outlined in this report and consider grants aligned with the strategies we have laid out.
The findings in this report will inform the grantmaking strategy for the Giving Green Fund and our list of Top Climate Nonprofits. Therefore, donors interested in progressing this work can choose to donate directly to the Giving Green Fund.
Giving Green has conducted the following cost-effectiveness analysis related to this strategy: cost-effectiveness analysis of open-source grid planning models in LMICs.
Background
Electricity consumption is expected to grow significantly worldwide, and low- and middle-income countries (LMICs) are no exception. Based on International Energy Agency (IEA) 2025 World Energy Outlook data, LMIC electricity generation, excluding China, is projected to grow by 135% from 7,850 TWh to 18,453 TWh between 2024 and 2050 under current policies.1 In comparison, electricity generation in high-income countries (HICs) is only expected to grow by 54%.2 LMIC electricity demand is expected to increase due to population growth, improved energy access, and further industrialization. However, additional factors not captured under current policies—such as the rise of data centers—could push demand higher still.
Demand growth on this scale could spur mass buildout of new fossil fuel generators and, as a result, significantly increase emissions. Based on IEA data, we calculate that if the carbon intensity of LMIC grids remains constant, electricity generation in LMICs could emit up to 9.6 billion tons of CO2e in 2050.3 However, grid carbon intensity is likely to decline because low-carbon electricity sources (such as wind and solar) are becoming cost-competitive in LMIC electricity markets and diluting fossil fuels’ contribution to the grid. Based on a separate model from ClimateWorks Foundation, which defines mitigation potential as the difference in emissions between a business-as-usual and mitigation scenario, we estimate that the mitigation potential in 2050 related to electricity generation in LMICs is approximately 6.4 billion tons of CO2e, roughly 10% of global emissions in 2050.4
Despite the increasing cost-competitiveness of renewables, support for fossil fuels and barriers to renewable energy are still preventing many LMIC electricity markets from decarbonizing. For instance, although the price of solar panels fell by roughly two-thirds between 2014 and 2024, conventional energy sources supplied about four times as much of the growth in India's electricity generation as solar did over the same period, adding 568 TWh of annual output against 128 TWh from solar.5 Recent price trends in solar and batteries may drive even more development in the coming decade, but there are still many unresolved challenges, as discussed throughout the report, that will limit investments and prevent wide adoption.6
A core barrier to scaling clean electricity in LMICs is the outsized risk investors face relative to expected returns, which severely limits the capital available to projects. Risk in LMICs can take many forms—policy and regulatory uncertainty, currency exposure, weak contract enforcement, and offtaker non-payment—and their cumulative effect is a cost of capital two to three times higher than in HICs.7 Many of these risks stem from challenges in building, updating, and strengthening LMIC electricity markets and grids, such as poor utility financial health, minimal local technical capacity, and limited market insight into bankable projects. Until these barriers are removed, risk will continue to keep the cost of capital high and prevent finance from reaching LMICs. As a result, countries will be unable to deploy enough clean electricity to meet new demand, replace existing fossil fuel generators, and avoid steep emissions growth.
Meeting growing demand and deploying large amounts of clean electricity will require new grids. Unlike high-income countries (HICs), whose grids tend to be older and in need of repair, LMIC grids tend to be newer and likely to last for several more decades. LMICs do not have sufficient existing grid infrastructure required to meet growing demand, meaning countries often need to build new electricity infrastructure rather than add to what already exists.8 As utilities and national ministries plan and build new grid infrastructure to meet growing demand, they have an opportunity to build in a way that favors clean electricity. The same window, however, could just as easily lock in new fossil fuel generation. Because LMICs are building grid infrastructure now, its emissions consequences will persist for decades, making this moment critical for future grid emissions. These grid investments go beyond poles and wires. LMICs will need to modernize and digitize their grids to manage the complexity of adding high levels of variable renewable energy (VRE) like wind and solar; VRE output rises and falls with the weather, and as a result, needs to be balanced against demand minute by minute.
Building new grid infrastructure in LMICs is necessary but insufficient on its own to attract private investment and build new clean electricity projects.9 While new infrastructure will physically support the development and integration of new clean electricity projects, it does not on its own remove the risks that hold investors back. Many LMIC utilities are poorly managed and fail to cover their own costs, let alone turn a profit.10 As a result, the service they provide is often poor and inconsistent, leading to frequent power outages.11 Without well-functioning utilities and grids—including both distribution and transmission grids—investors are unlikely to commit capital because returns are too uncertain. Utility mismanagement is a precursor to many of the investment risks discussed throughout this report.
Attracting significantly more private and public capital is critical to funding grid expansion and modernization in LMICs and the subsequent buildout of clean electricity. Several sources estimate that to stay on track with climate targets and reduce grid emissions, LMICs will need to attract upwards of $1 trillion USD in additional investment per year by 2035.12 In other words, current investment rates, which sit near $380 billion, will need to grow roughly three to four times.13 Yet, the LMIC share of global grid investment has fallen over the past decade.14 While power decarbonization in LMICs requires far more investment, the binding constraint is not the global supply of capital, which is ample, but whether that capital can reach LMIC clean electricity projects at a level of risk investors will accept.15
Refining Our Research Scope
Two overarching barriers prevent capital from flowing to LMIC clean electricity projects at scale: the risks investors face, and the shortage of bankable clean electricity projects.16 Investment risks take many forms. This report examines a subset of these risks where we think philanthropic funding has the most traction, such as those arising from LMIC grids, electricity markets, and project development. We may explore additional risks, such as currency and macroeconomic risk, in future research.
Unlike our country-specific strategies, Giving Green’s derisking clean electricity investment in LMICs strategy takes a cross-cutting, multi-country or regional approach.17 Most of the challenges and solutions discussed in this report apply broadly across LMICs, and we aim to identify philanthropic opportunities that will significantly improve capital flows to countries and regions facing similar investment bottlenecks.
-----
1 We exclude China from this calculation and throughout this strategy, despite being considered an LMIC by the World Bank, because we deem it to be an outlier. The challenges China faces in deploying clean electricity are very different from those most other LMICs face. In fact, China has become a leader in financing projects and deploying clean electricity. As a result, the necessity and type of philanthropic interventions in China will be different from what is covered in this strategy report. We find that separating China from LMICs is a common practice, as many of the sources we cite, including the IEA, do the same.
2 LMIC electricity generation is based on regional data from Africa, Central and South America, Eurasia, and South Asia excluding China, Japan, and Russia. However, it includes data from some HICs that we were unable to remove, and is therefore an imperfect estimate. Calculations based on the IEA, 2025(a) data can be found here.
3 We calculated the average carbon intensity of LMICs to be 518g/kWh in 2025. We used data from Our World in Data, 2026(a) and LMIC country determinations used by the World Bank. We did not include China, however, as we view this to be out of scope of this strategy. Calculations can be found here. The carbon intensity was then multiplied by the total generation calculated on IEA, 2025(a) data. Calculations for the total generation can be found here.
To calculate the percentage of emissions, we use the world carbon intensity from 2025 from Our World in Data, 2026(a) (458g/kWh) and the total electricity consumed globally in 2024 from IEA, 2025(a) data, which can be found here, (31,229.37 TWh) to calculate the total current emissions from the global power sector (14,303 million tons of CO2). We used United Nations Environment Programme, 2025 for 2024 and 2050 global emission data “Table 2.1 Total global emissions by source” & “Table ES.1 Global total GHG emissions in 2030, 2035 and 2050, and estimation of associated emissions gaps under different scenarios.”
4 We define mitigation potential as all potential emissions reductions from a given sector or strategy, not exclusively emissions reductions attributable to philanthropic funding. We source the majority of our mitigation potential estimates from ClimateWorks Foundation.
Using data from ClimateWorks Foundation we calculated the global emissions in 2050 under a business as usual scenario to be 64.17 billion tons of CO2.
5 Using years 2014-2024. Solar voltaic prices from Our World In Data, 2025(a)). Coal and solar generation: Our World in Data, 2026(b))
7 “For the moment, the cost of capital for a typical utility-scale solar project can be two or three times higher in key emerging economies than in advanced economies or China, reflecting real and perceived risks at the country, sectoral and project levels.” IEA & IFC, 2023
8 “In total, only around 23% of the grid infrastructure in advanced economies is less than 10 years old, and more than 50% is more than 20 years old. In contrast, EMDEs have newer grids that were developed more recently to meet the increasing demand for electricity. About 40% of their total grid infrastructure is less than 10 years old, and less than 38% is more than 20 years old.” IEA, 2023
9 For context, “more than 90% of investments in [LMIC] grids are the responsibility of [state owned enterprises] SOEs, many of which are facing severe financial strains and lack access to capital. Private sector participation in electrical grids is limited in most cases to the distribution sector.” As a result, grid investments themselves could utilize private sector investment in addition to clean electricity projects. IEA & IFC, 2023
10 Only two of seventeen LMICs studied, and three out of the twenty four utilities from those same countries, were capable of recovering all of their costs. World Bank, 2020
11 “Overall outages for end users, commonly reported using the System Average Interruption Duration Index (SAIDI) in annual outage hours per customer, show huge variations in supply reliability. Customers in high-outage EMDEs such as Iraq and Papua New Guinea experience around 40 times the average outage levels of most other EMDEs, which in turn are still around three times the interruptions of India and the United States and around fifteen times China and the European Union.” IEA, 2023
12 1) CPI & GFANZ, 2025 finds that CapEx for clean electricity infrastructure in EMDEs will need to grow from $380 billion in 2025 to $1.3 trillion a year by 2035 to stay on track with targets for net-zero emissions by 2050. These numbers exclude China. 2) IEA & IFC, 2023 finds that EMDE clean electricity investments will have to grow from $262 billion in 2022 to $1,370 to $1,860 billion per year by 2035. This similarly excludes China. 3) GRA, 2025 finds that to stay on track with IRENA’s 1.5℃ goal and triple the deployment of renewables, financing for solar and wind projects in EMDEs would have to increase from $109 billion in 2024 to $3,768 billion between 2024 and 2030, or $630 billion per year.
13 CPI & GFANZ, 2025 finds that CapEx for clean energy infrastructure in EMDEs will need to grow from $380 billion USD in 2025 to $1,300 billion USD a year by 2035 to stay on track with net zero by 2050 targets. These numbers exclude China.
14 “while investments in grids have increased globally, jumping 8% in 2022, the share of investments in grids in EMDEs have fallen in the last decade.” IEA, 2024(a)
15 “The core challenge in climate and SDG finance in Emerging Markets and Developing Economies (EMDEs) is not the magnitude of financing that is needed – a few trillion dollars per year – since the global saving per year of around $30 trillion is readily adequate to the task. The core challenge is the accessibility of those funds.” Columbia Center on Sustainable Investment, 2025
16 Bankable projects refer to projects that are sufficiently developed and low-risk that a lender or investor would be willing to finance them.
17 See our reports on Decarbonizing India’s Power Sector and Decarbonizing Indonesia’s Power Sector for country-specific strategies, and our Accelerating Climate Change Mitigation in LMICs prioritization brief for a comprehensive overview of our philanthropic strategies in LMICs.
Pathways to Decarbonizing Electricity in LMICs
Summary of key pathways to reduce LMIC electricity emissions
- Expanding and modernizing grids: Meeting growing LMIC electricity demand with clean energy will require substantially more distribution and transmission grid infrastructure because (1) new demand is emerging in areas that local grids have not yet reached, and (2) the best clean electricity generation sites often lie far from centers of demand. Physically building grid infrastructure is capital-intensive and country-specific, but the planning that decides what gets built, and where, is work philanthropy can support at a regional level.
- Operating reliable grids: Unreliable and poorly managed distribution grids raise the risk of LMIC clean electricity projects and push offtakers toward costly backup fossil fuel generation. Philanthropy can provide data, tools, and technical assistance at a regional level to improve how utilities and grid operators function, lowering the risk of clean electricity projects.
- Making projects more accessible to investors: Even where promising projects exist, investors will not enter a new LMIC market without a visible pipeline of bankable projects. Philanthropy can support regional project preparation and aggregation vehicles to develop accessible and investable project pipelines.
We prioritize all three pathways to derisk clean electricity in LMICs, each of which is well-suited to regional and multi-country philanthropic intervention.
Expanding and Modernizing Grids
Meeting growing LMIC electricity demand with clean energy, especially VRE, will require substantially more grid infrastructure for two reasons: new demand will emerge in places the grid has not yet reached, and the best sites for large-scale clean electricity generation are often far from centers of demand.18
LMICs, with the exception of parts of Latin America, have lagged in transmission investment and buildout.19 Between 2016 and 2022, LMICs spent under $200 billion a year on transmission and distribution. Reaching net-zero emissions by 2050 would require over $300 billion per year in additional transmission and distribution investment from 2023 to 2030, rising to roughly $600 billion per year from 2031 to 2050.20 For comparison, from 2023 to 2050, HICs will need $200 billion less per year than LMICs for transmission and distribution.21
While all LMICs need to spend more on transmission and distribution, they are not all starting from the same baseline. LMICs in Asia and Latin America—which are both close to reaching universal electricity access—require grid buildout to meet new sources of demand and connect new projects. Other countries, especially in sub-Saharan Africa, still face large electricity access gaps, meaning they need to build grid infrastructure to interconnect neighboring grids, meet growing demand, and connect communities for the first time.22 Part of that access gap can be closed with clean electricity resources that are off-grid, such as standalone resources and mini-grids.23 Off-grid resources, however, are not a substitute for grid expansion. They remain a very small share of installed clean electricity capacity, and grid extension is more cost-effective compared to mini-grids when distances are shorter or demand is higher, or both.24 While mini-grids will have an important role to play, LMICs will need to expand their grids to decarbonize and meet the large growth in demand.25
While most countries, including high-income countries, struggle to deploy grid infrastructure, the challenges they face are not always the same. Many of the interventions that support grid deployment fall outside the scope of this report because they are targeted at country-specific challenges, such as navigating domestic political environments, mobilizing domestic public financing, and designing and implementing specific policies and regulations.26
Some challenges, however, are shared widely enough that regional interventions can support grid infrastructure development across multiple countries. We think planning is the clearest example. Deciding which infrastructure to build, and where, requires complex modeling to understand how new assets will interact with existing systems. Utilities and national ministries rely on this modeling, including integrated resource planning (IRP) and integrated distribution system planning (IDSP), to decide what to build. Those decisions shape how much clean electricity ends up in an LMIC's generation mix.27
Not all LMICs conduct an IRP/IDSP or extensive high-quality modeling themselves. Many rely on HIC governments and modelers to do this work on their behalf. While the extensive experience HICs offer is helpful, it also means LMICs are not building their own modeling capacity and know-how. As a result, policymakers may not understand or consider modeling results in their decisions.28 Furthermore, the results of foreign modeling may also be less accurate or relevant, since modelers unfamiliar with a given country are more likely to miss local context.29
LMICs that want to build domestic modeling capacity, however, run into further constraints. Models that are widely used to plan grids can be expensive, and LMIC institutions often lack the technical staff to run them.30 Even if planners in LMICs have the data and can run models themselves, models built for LMICs frequently omit country-specific considerations, leaving gaps or inaccuracies in their findings.31 Additionally, the datasets LMICs use are often of poor quality or, in some countries and regions, do not exist at all.32 Even with high-quality datasets, interoperability challenges across different modeling tools can create friction.
To plan and build grids that support clean electricity, LMICs need stronger modeling capacity, better data, and tools they can use themselves.33 Specifically, expanding open-source datasets and modeling tools, and supporting local institutions to adopt them, can improve visibility into the grid and support planning for the infrastructure needed to deploy clean electricity.34 Better planning also lowers investor risk, since a grid planned around clean electricity is less likely to result in stranded or curtailed clean electricity assets. We think philanthropic support at a global and regional scale can strengthen this planning capacity and, in turn, LMICs’ clean electricity deployment.
Operating Reliable Grids
Existing power reliability and grid management issues are a barrier to clean electricity deployment, with most LMICs experiencing a significantly higher level of power disruptions than HICs.35 Specifically, “the average customer in low-income countries faces about 80 additional hours of lost service and roughly 60 more outages per year compared to customers in high- and upper-middle-income countries.”36 Even when LMIC grids deliver power, the quality can be poor enough to damage equipment. Poor power quality can mean inconsistent and excessive voltage fluctuations, power surges, current leaks, and ground faults, to name a few.37 Reliability problems are widespread across LMICs, and outages are longest and most frequent in South Asia, followed by sub-Saharan Africa.38 These figures are self-reported, so the true picture is likely worse.39
We think grid management is a major—albeit tractable—contributor to reliability problems in LMICs, which are constrained by deeper financial and political dynamics. Within that constrained environment, weak processes compound the problem. For example, utilities may negotiate power purchase agreements (PPAs) without transparency, which can result in inefficiency and inflated, uncompetitive returns.40 Capital wasted in this way reduces the capital available to maintain the grid and deliver reliable service.41
We consider other factors outside the direct control of grid operators that lower the reliability of LMIC grids—such as electricity theft and corruption—important, but they are not a key focus of this strategy given they are country-specific issues.42 Some of these challenges, however, can also be addressed by improving grid reliability; as a result, we review them in greater detail below. We focus on established best practices that can improve utility performance and open electricity markets to private participation. We think supporting their adoption is well-suited to philanthropic funding.43
Addressing electricity instability matters for clean electricity deployment because investors treat it as a direct threat to returns. For example, industrial offtakers such as factories and mines, which account for a large share of demand on LMIC grids, cannot operate productively or competitively without a stable electricity supply.44 Unreliable electricity supply also erodes the willingness of industrial and household customers to connect to the grid and pay for electricity, pushing some toward illegal connections, which in turn worsens the problem operators are trying to solve.45 These challenges come even as governments apply pressure to keep electricity rates low to appeal to offtakers and gain political support.
Low rates, however, create a problem of their own.46 Utilities cannot cover their costs when rates are too low, and as a result, cannot invest in the improvements that would otherwise raise service quality.47 Offtakers experiencing continued poor service often turn to costly backup fossil fuel generators to maintain consistent electricity access.48 The cumulative result is an electricity market that struggles to attract investment, and one where emissions may rise as backup generation fills the gap.
While the current state of reliability is already a barrier to investment, rising VRE shares could add to that challenge.49 Over the last 10 years, grid-connected VRE capacity in LMICs grew by 113%, an increase of 940 GW in new capacity, and we expect this rate of growth to continue.50 The challenge is that VRE output fluctuates by definition, and balancing and managing the grid becomes more challenging as operators add more VRE.51 Every country faces different technical barriers to achieving a more reliable and well-managed grid, with some needing more physical investments and maintenance.52 Most LMICs, however, lack good visibility into the state of their own grids, and stand to benefit from digitization and smart metering, which can generate higher-quality data while allowing operators and regulators to spot issues earlier and restore service faster.53
In addition to monitoring, grid operators also require improved tools and models to plan and operate the grid more reliably.54 These tools become even more critical when attempting to implement high levels of VRE.55 As a result, LMICs will need to adopt new and adapt existing tools to bring large volumes of clean electricity onto the grid. Poor data quality, however, has held back adoption of grid management and forecasting models in LMICs.56 Ensuring operators use data properly is the critical next step, and this challenge is not unique to LMICs. Even operators of fully digitized grids are not using the data they collect to maximize impact on their operations.57
As a result, philanthropic funding for data collection is unlikely to improve operations on its own. Philanthropic support must reach the processes and staff that turn data into decisions. As such, we treat tool development and capacity building as complementary approaches.
Developing higher-quality datasets and using better models will ensure grids operate more reliably and allow more clean electricity facilities to connect to the grid. As a result, investors will price LMIC grid risk lower, because a better-run grid reduces the chance that a project is curtailed or that the utility fails to pay for the power it has contracted. We think philanthropy is well-suited to support development and implementation of better tools at a regional level and, in doing so, unlock additional clean electricity financing.
Making Projects More Accessible to Investors
Even where promising projects exist, connecting them with investors is a challenge; without a large, clear, and predictable pipeline of bankable projects, investors are unlikely to enter a new LMIC market.58 Compared to international developers, local developers who have a better understanding of the LMIC regions in which they operate find it more difficult to access foreign sources of capital.59 To lower market-entry risk and increase access to financing, LMICs need a visible pipeline of bankable projects. It is important to note that there are tools focused on the financial sector that can also lower the risk of entering new LMIC markets. We do not cover these tools in this strategy but may explore them in future research.
Developing a clean electricity project and proving it is financially viable takes substantial resources and time. This process, known as project preparation, presents many potential roadblocks: securing early-stage funding, obtaining permits, and finding offtakers and reliable revenue, among others.60 Each stage is an opportunity for the project to fail. To improve the odds, development banks, development finance institutions, and climate funds have established project preparation facilities (PPFs) to support clean electricity projects in LMICs. PPFs offer services that help projects reach bankability, including proof-of-concept and feasibility studies, technical advice, planning support, and introductions to investors.61 While several PPFs already exist, there has been a growing trend of shrinking global development budgets and services, as seen with the recent dismantling of the U.S. Agency for International Development (USAID).62 The resulting gap leaves room for philanthropy to support PPFs. For instance, the Global Energy Alliance for People and Planet has recently begun supporting this kind of work.63 While we see the case for philanthropic support of PPFs, we are less certain whether smaller funders can help fill a gap of this size and have material impacts. As a result, we have decided not to include PPF support as a prioritized sub-strategy.
In addition to PPFs, developers and financiers can build project pipelines by aggregating projects into an investable portfolio or platform. Aggregation is a widely used and effective way to derisk projects and mobilize capital to LMICs.64 Investing in a single project carries more risk because its outcome is essentially binary; it succeeds or fails, and the investor’s return depends on that one outcome. Aggregating projects, however, spreads that risk. Even if one project underperforms, others in the portfolio can offset it, which raises the likelihood of an acceptable overall return.65 The same logic extends beyond generation projects. Many investors are unable or not permitted to invest in foreign energy infrastructure directly, but aggregation vehicles let them invest indirectly.66
These vehicles can also attract more investors to LMIC markets by solving a size problem: investors tend to set minimum investment sizes to keep transaction costs low, which prices out the smaller clean electricity projects common in LMICs. Pooling projects together lets investors make one large investment while still funding smaller-scale projects.67
Aggregating projects is a high-leverage intervention to create clear project pipelines for investors. Private capital is unlikely to support a transparent aggregation structure that communicates its approach and lessons learned because that transparency mainly supports other investors, not the one footing the bill. As a result, we think philanthropy is well-suited to support the development and dissemination of these successful strategies.
-----
18 “In lower-income economies, electricity demand growth is likely to be the result of connecting many new households and businesses, calling for significant grid expansion.” IEA, 2023
“Many solar PV projects and offshore wind farms are often located far from key demand centres like cities and industrial hubs. Without significant grid expansion, these resources cannot be fully and cost-effectively harnessed.” IEA, 2025(b)
19 “Europe, the United States, China, India, and parts of Latin America are leading the way, and global investment in power transmission grew by 10% in 2023 to reach USD 140 billion. There is a strong regional imbalance in investment patterns, with advanced economies and China accounting for about 80% of the global total.” IEA, 2025(b)
20 Fig. Average annual transmission and distribution investment in EMDEs and advanced economies in the Announced Pledges Scenario and Net Zero Scenario, 2016-2050. In this source IEA uses the term EMDEs which we treat as LMICs. IEA, 2023
21 Fig. Average annual transmission and distribution investment in EMDEs and advanced economies in the Announced Pledges Scenario and Net Zero Scenario, 2016-2050. In this source IEA uses the term advanced economies which we treat as HICs. IEA, 2023
22 “While regions such as developing Asia and Latin America are close to universal access to electricity, substantial gaps persist in many countries in sub-Saharan Africa. This region accounts for around 80% of people without electricity access” IEA, 2025(b)
23 “Achieving universal access to electricity in Africa by 2030 requires a tripling of the current rate of progress, and strongly relies on stand‐alone and mini‐grid systems. Under the NZE Scenario this means reaching about 65 million cumulative household connections to the main grid, with a further 48 million households connected to mini-grid solutions and about 42 million to stand-alone grids.” IEA, 2023
“Most African countries run isolated national grids that are small, costly and unevenly supplied. Regional energy interconnectivity is the key to unlocking efficiency, affordability and renewable growth.” WEF, 2025
24 1)In 2025, only 0.37% of global renewable energy capacity was off-grid. In Africa, which had the highest share of any LMIC region, the figure was 1.6%. Calculations were made using data from IRENA STAT, 2026 and calculations can be found here.
2) cost effectiveness of grid connections vs mini-grids were sourced from Figure 2.10 Distance as a function of load size: Break-even grid extension. ESMAP, 2022
25 It is important to note that mini-grids can range in size, and at times can even scale up to multiple MW of generation capacity. As a result, there are occasions and geographies where a mini-grid may make sense to meet a large source of demand, especially when it is built to be connected with the grid in the future. Despite this, we do not believe that mini grids will be the best solution across LMICs globally.
26 Fig Key policy recommendations to boost grid capacity development. IEA, 2023
27 “The IRP process typically begins with setting clear objectives that reflect the priorities of a particular country, region or local jurisdiction — such as increasing renewable energy, reducing costs or improving energy access. Planners forecast future energy demand, evaluate resource options and use modeling tools to develop and compare scenarios.” WRI, 2026
“An Integrated Distribution System Planning (IDSP) process provides a decision framework for developing holistic infrastructure investment strategies for local electricity grids. The planning process involves the determination of grid system requirements that are needed to achieve reliability, resilience, safety, affordability, and other objectives. The process includes the development of a technology roadmap to modernize the grid and enable the integration, utilization, and orchestration of grid-edge technologies like storage, microgrids, and electric vehicles.” DOE, 2026
28 “Many LMICs lack capacity to draw on energy modelling for decision-making due to, for example, limited human and financial resources. A longstanding concern in policymaking has been a lack of institutional capacity to use and engage with energy modelling. It is often the case that modellers from HICs lead or support modelling projects in LMICs, given their comparatively longer experience.” Fuchs et al., 2024
29 “Other participants [...] also cautioned that external modellers often lacked specific contextual knowledge to use appropriate assumptions and data, as well as navigate stakeholder expectations. To address this, participants emphasised the importance of involving local experts in the modelling process in order to enhance the credibility of inputs and outputs, particularly for policymakers.” Fuchs et al., 2024
30 “While simulation tools have gained prominence in providing transition insights to modelling the energy paradigm of developed countries, their developing country counterparts have yet to gain a clear transition pathway. This could be due to the cost of commercial tools, technical know-how, and the complex attributes and under development of developing countries’ energy systems transition paradigm.” Shari et al., 2025
31 “Despite the fact that some EPMs have been widely adopted for energy system planning in developing countries, they lack consideration of a substantial number of issues affecting developing contexts; e.g. the effects of a lack of innovation, and the varying nature of privatisation, decentralisation and competition in the energy industry.” Debnath & Mourshed, 2018
32 “Generally, a lack of high-quality, accurate data is a critical obstacle in designing modelling approaches, especially in LMICs. This imbalance in data availability represents a risk of perpetuating injustices and inequalities in energy planning” & “Participants were critical of external modellers who build models based on inappropriate data and which therefore failed to reflect local realities: ‘One major problem we also have in Africa is the lack of data.’” Fuchs et al., 2024
33 “We present an expanded set of energy planning considerations and related modelling methodologies that can better capture the diverse risks LMICs often contend with when building energy systems in contemporary conditions. We propose three ways of taking this forward – i) focusing on making data and modelling available, based on open science principles; ii) prioritising context-specific support for modelling in countries with lower planning capacity; and iii) developing and expanding networks of practice that support LMIC modelling practitioners.” Daly et al., 2026
34 “Multiple entities have made progress in recent years in improving asset and system visibility through diverse platforms. [...] Much greater granularity is required for spatial analysis to identify weaknesses and improve stability. Open-source data sets and tools can support electricity access planning and help to target loss-reduction measures.” IEA, 2024(a)
35 “Overall outages for end users, commonly reported using the System Average Interruption Duration Index (SAIDI) in annual outage hours per customer, show huge variations in supply reliability. Customers in high-outage EMDEs such as Iraq and Papua New Guinea experience around 40 times the average outage levels of most other EMDEs, which in turn are still around three times the interruptions of India and the United States and around fifteen times China and
36 World Bank, 2026 p.7
37 “In some recently electrified areas, voltage often falls more than 20% below standard levels during peak demand, leaving households and businesses vulnerable to equipment damage and disconnections.” Phillips et al., 2025
Power quality is defined as “ the delivery of clean and stable energy, measured in consistent voltage and current sinusoidal waveforms from the utility to the consumer. The traditional grid with large central power stations and transmission and distribution networks is a very complex system, which make it extremely difficult to ensure the delivery of quality power to the end users.” NREL, 2021
38 “South Asia stands out as the region with the most prolonged and most frequent outages, followed by SubSaharan Africa. In contrast, utilities in the other regions cluster at much lower and relatively similar levels of outage duration and frequency.” World Bank, 2026
39 “SAIDI and SAIFI indicators are self-reported by utilities and likely to suffer from measurement errors [...], and potentially, from reporting errors. [...] Misreporting may be systematically correlated with institutional quality. The direction of bias induced by misreporting is likely to be downwards (the data would be less likely to reveal greater outages in countries with weak control of corruption), as utilities may be more likely to misreport (under report outages) in contexts of weak control of corruption.” World Bank, 2026
40 PPAs are long-term contracts that utilities use to purchase a certain amount of electricity for a set price from a generator.
41 “Ghana’s expansion of generation capacity to respond to severe power shortages and extended blackouts during 2011-16 shows that Power Purchase Agreements (PPAs) with Independent Power Producers (IPPs) were conducted through nontransparent, non-competitive processes. Reliability remained a problem even in the presence of excess generation capacity because of weak integration with and planning of the power system.” World Bank, 2026
42 “Another channel through which weak institutions can affect utility performance and the reliability of electricity supply is through more widespread corruption in society, often in collusion with frontline utility staff.” World Bank, 2026
43 “Duration and frequency of outages are lower among privately owned utilities, and, regardless of ownership, in countries when there is stronger control of corruption.” Additional best practice interventions are described between pages 28 and 38. World Bank, 2026
44 “power outages negatively and significantly affect firm-level revenue-based total factor productivity, with a 9 percent lower unconditional average productivity for exposed firms compared to nonexposed firms." World Bank, 2023
45 “Over half of utilities in LICs and LMICs have outstanding customer payments (receivables) equivalent to more than 150 days of revenue, compared to only 20 percent of utilities in UMICs and HICs. Delayed or inconsistent payments for electricity by public sector customers, such as government offices, publicly owned mines, or water utilities, often make up a disproportionate share of receivables.“ & “Poor collection performance, especially by distribution utilities, is often felt across the power sector because poor collection means that less cash is available to pay upstream generation and transmission utilities.” World Bank, 2024(a)
“The relationship between payment and supply is completely broken: customers no longer see a reason to pay their bills because power is unreliable or intermittent, and utilities no longer see customers as essential for revenue (they rely on government bailouts).” World Bank, 2026
46 “Political pressure to provide subsidized or free power to certain groups of consumers (e.g. agriculture sector) also undermine the cost recovery effort.” World Bank, 2020
47 “chronic poor financial performance of electricity utilities is pervasive in the developing world—resulting from underpricing, excessive losses, and bill collection failure—and has for decades been a main driver of investment shortfalls, under-maintenance of infrastructure, power shortages, poor quality of supply.” World Bank, 2020
“Utilities that do not recover costs present greater risks to investors, will face higher financing costs, and will struggle to attract financing at the scale required to achieve the energy transition and universal access.” World Bank, 2024(a)
48 IFC, 2019
49 “Clean energy gains risk becoming a source of fragility rather than resilience.” Phillips et al., 2025
50 We utilized IRENA, 2026 data from 2015 and 2025. Calculations of LMIC data, using the World Bank LMIC country determinations, can be found here.
51 The level of challenge will also depend on how the grid is designed, as discussed in the previous pathway. Systems designed for VRE and clean electricity will be more capable of absorbing some of the risks. “The VRE integration challenges for grid operators and planners stem from both the inherent characteristics of VRE resources (i.e. variable with limited predictability; site-specific) and the characteristics of the system into which they need to be integrated.” ESMAP, 2019(a)
52 “In low-income countries, reliability may be just one of many fundamental constraints across the power sector, alongside generation adequacy, transmission bottlenecks, and underfunded maintenance. Underinvestment may span generation, transmission, and distribution alike, though the relative neglect of grid moderniza-tion and reliability is especially acute. Middle-income countries, by contrast, often face more specific grid modernization challenges—such as integrating variable renewables, managing urban load growth, or upgrading aging distribution networks—where incentive mechanisms may be more readily applied.” Phillips et al., 2025
53 “Smart grid technologies such as advanced metering infrastructure (AMI), smart meters, and remote sensors enable real-time monitoring, faster fault detection, and quicker restoration of service”; “Smart meters are perhaps the most powerful tool in this growing suite of technologies because of their integration with [advanced metering infrastructure (AMI)], which serves as the connective layer between centralized data tools and more decentralized data sources.” Phillips et al., 2025
54 “High-resolution real-time and advanced meteorological forecasts are also important for accurate generation and consumption forecasting, as well as assessing vulnerabilities to extreme weather and preparing for the associated risks” & “Due to the variable nature of wind and solar PV generation, improved forecasting can support the secure and efficient operation of the power system and minimise the need for balancing actions.” IEA, 2024(c)
55 “The fast penetration of renewable energy, and especially, a high level of their penetration into the power grid requires an adapted power system planning, better forecasting methods, introduces challenges in grid management, imposes stringent requirements for VRE integration into the grid, and necessitates standardization and structured process for the conducting studies to ensure compliance with the gridcode requirements.” ESMAP, 2019(b)
56 “Region-specific and economically-aware forecasting models are indispensable to understanding these localized challenges and optimizing deployment strategies across diverse economic systems. These cross-regional effects, however, hinge on data quality and reporting consistency, which vary widely across developing regions.” & “in developing countries, RE forecasts are often constrained by low data quality, measurement gaps, and irregular reporting practices.” Sariman & Kecebas, 2026
57 “A survey of 10 Transmission system operators(TSO) shows that most agree their control rooms do not make full use of data analytic applications, even when they have fully digitalised grids equipped with sensors and remote control. The energy system is collecting more data than ever, but too much of it remains idle, or stuck in siloed storage, with significant untapped potential." IEA, 2024(a)
58 “Another prominent barrier to increased investment in these markets is buildout a pipeline of large, predictable and bankable projects, which are a critical signal to attract investors, especially large and international ones who generally enter markets only if there is enough preparation expected growth to cover for the transaction costs.” IEA, 2024(b)
59 “local developers can find it more difficult to access finance from international sources relative to international developers. Therefore, increasing the availability of finance from local institutions could help to stimulate more investment from local developers, which also makes use of local financial advisors and lawyers and therefore could help to reduce the costs involved in renewables projects.” AfDB, 2020
60 “The key challenges include obtaining sufficient financing for each stage buildout, securing appropriate legal or financial advice, addressing environmental and social considerations, dealing with unforeseen policy or regulatory changes, and adjusting course if a key donor or partner withdraws support. It is also important to ensure reliable revenue streams for clean energy projects relative to alternatives.” ODI, 2016
61 “project preparation support may include a range of elements including the provision of technical advice for design and conceptualisation, funding for prefeasibility studies and project identification, matching functions aimed at linking projects with funding from other sources and investors, plus other supporting functions.”ODI, 2016
62 “The recent cuts to US foreign aid have left a huge gap in global development finance, disrupting development programs in low- and middle-income countries. Many are looking to Europe, China, and the private sector, but they are unlikely to entirely fill the void.” MSC, 2025
63 “The Global Energy Alliance for People and Planet (GEAPP) is one such example, supporting early-stage renewables projects through grants and concessional financing that bridge the gap between project conception and financial close.” IRENA, 2025
64 “While de-risking can occur at the project level, portfolio solutions are widely recognized as the most effective solution to mobilize capital in EMDEs. The diversification they offer significantly enhances risk mitigation, providing robust strategies to address various types of risks.” WEF, 2024
65 “Some other important impediments include unattractive risk-return profiles in unproven markets and lack of scalable quality projects. This suggests that pooling projects through structured financial instruments could help in some cases. Pooling several projects in a structured fund and creating ABS-type instruments would attract more institutional investors and large investment funds into less developed economies, which may not even have an investment grade, as well as diversify risks. This would raise global climate financial flows and bring them closer to required levels.” Prasad et al., 2022
66 “Infrastructure investment trusts (InvITs) offer another example of an innovative instrument. These are pooled investment vehicles regulated by the Securities and Exchange Board of India that give investors exposure to infrastructure assets. The main goal of InvITs is to promote India’s infrastructure sector by encouraging individuals or institutions to invest in assets that they would not otherwise have direct access to. [...] There are a number of variations worldwide that aim to achieve the same objective: attracting investors to operating infrastructure assets and allowing developers to free up capital to continue developing new ones.” IEA & IFC, 2023
67 “Project aggregation platforms and securitisation vehicles can overcome the asymmetry between the relatively small size of most energy transition projects in EMDEs and the relatively large minimum investment size that major institutional investors require. These platforms can pool large numbers of smaller projects and thereby create standardised investment-grade multi-asset portfolios, reducing transaction costs, diversifying risk and attracting interest from institutional investors.” IEA & IFC, 2023

Assessment of Philanthropic Sub-Strategies
We identified four promising philanthropic sub-strategies and evaluated each sub-strategy's scale, feasibility, and funding need (see Table 1). For more information on these metrics and our research process, see Giving Green's Research Overview.

We chose to center sub-strategies with at least one high and no low ratings in our strategy. On that basis, we prioritize four sub-strategies: developing and aggregating knowledge to improve regional capacity, creating strong aggregated project pipelines, improving utility operations, and implementing grid planning and reliability best practices. Readers can find our assessment of the sub-strategies we did not prioritize in our research dashboard.
To analyze the funding need of each sub-strategy, we reviewed tax forms, public funder databases, and funder press releases for grants to nonprofits working on our prioritized sub-strategies. When we were uncertain about the specifics of a grant, we only attributed a portion of funding to derisking clean electricity investments in LMICs, in proportion to the grantee’s relevant work. These estimates also skew heavily toward U.S. and U.K.-based funders, where data tends to be publicly available. Given our informed assumptions and limited data sources, we hold these calculations with low confidence.
Developing and Aggregating Knowledge to Improve Regional Capacity
- Scale: 🟡🟡⚪️ Medium
- Feasibility: 🟡🟡⚪️ Medium
- Funding need: 🟢🟢🟢 High
Scale: Medium. This sub-strategy covers two related activities: (1) building technical capacity among utility staff, regulators, and energy ministry officials through training and peer exchange, and (2) making energy data, tools, and analysis publicly available so that those institutions—and the investors assessing their markets—can act on them. Utility reform, project pipelines, and grid reliability all require technical capacity and tools to design and implement, and without them, utilities and regulators cannot deliver results.69 Data gaps further compound the problem. For example, when utilities do not publish PPA terms and pricing, new entrants face an information asymmetry that deters competition.70 This sub-strategy's success is a precondition for our other sub-strategies, so we think its emissions impact is substantial but likely runs through downstream efforts rather than operating on its own.
Feasibility: Medium. Developing regional expertise takes time and sustained funding. For example, building university programs or training pipelines that create durable capacity can take years, and will require more than a single grant cycle to see results. We think, however, that the more tractable path is to build on existing expertise. Convening local experts into regional consortia, structuring peer exchange between utilities and regulators facing similar problems, and publishing comparable data are all achievable at a regional level and do not require an in-country presence in every target market.71 Regional utility associations, university networks, and energy research institutes already operate this way.72 We are, however, less certain how often knowledge products translate into changed decisions, which also depends on whether the institutions receiving them have the authority and incentive to act.
Funding need: High. There is still a large gap in available datasets, tools, and expertise in many LMICs.73 While some organizations working to develop knowledge do receive philanthropic funding, we have not seen sufficient funding reach them. Specifically, we estimate that this sub-strategy received roughly $9 million in philanthropic funding in FY2023 and $11 million in FY2024.74 We have low confidence in this estimate, however, given the difficulty of separating capacity building from the programs it supports. We also think the funding gap has widened since USAID—long a major provider of training and knowledge support to LMIC energy institutions—was dismantled in 2025.
Creating Strong Aggregated Project Pipelines
- Scale: 🟡🟡⚪️ Medium
- Feasibility: 🟡🟡⚪️ Medium
- Funding need: 🟢🟢🟢 High
Scale: Medium. Financiers need a concentrated and predictable supply of high-quality bankable projects before entering a new LMIC market, because the cost of learning and underwriting an unfamiliar market is high, and a single project is unlikely to justify it.75 As more interventions—such as those covered in our other sub-strategies—derisk LMIC electricity markets, we expect the number of investable projects to grow, and those projects will need to reach financiers. Additionally, we think there are existing projects ready to receive funding that could benefit from aggregation. Given the limited project pipelines in LMICs attracting financiers' attention, we think the lack of project aggregation is a relevant and crucial barrier to securing financing and scaling clean electricity in LMICs.
Feasibility: Medium. Clean electricity projects in LMICs are often too small to attract private investors on their own, and their risk profiles are hard to manage at the individual project level. Aggregating projects into diversified portfolios addresses both problems. It spreads risk across projects, lowers the per-project transaction costs, and creates the investment volume that institutional investors need to participate.76 This type of work is well-suited to a regional approach, since a single platform can serve several countries and markets. It requires a large amount of coordinated funding, though, which makes it more challenging for smaller funders to support. That said, we think there are opportunities for smaller-scale philanthropic funding to support this work, such as sharing lessons learned in a market and conducting due diligence.
Funding need: High. Private sector and blended capital funds—a combination of private, public, and philanthropic capital—currently support project pipeline development. We estimate, with low confidence, that this sub-strategy received roughly $17 million in philanthropic funding in FY2023 and $16 million in FY2024.77 While the total is relatively large compared with our other sub-strategies, we think the space still needs additional funding to expand project pipeline development into more LMICs given the lack of current visibility into LMIC markets. We have also seen a heavy philanthropic focus on mini-grids and think support should expand to grid-connected projects as well. We also note that HIC governments have historically supported this work, but declines in official development assistance from several HICs, including the U.S., have made their support less predictable.78
Improving Utility Operations
- Scale: 🟢🟢🟢 High
- Feasibility: 🟡🟡⚪️ Medium
- Funding need: 🟢🟢🟢 High
Scale: High. Utility financial weakness is a significant barrier to private investment in LMIC electricity markets. Many LMIC utilities are unable to make a profit for various reasons, such as tariffs set below the cost of supply, poor revenue collection, and mismanagement of funds.79 When a utility is unable to operate profitably, investors face uncertain returns because they cannot be confident the utility will honor a PPA or pay feed-in tariffs on time.80 As a result, investors avoid investing unless they receive large concessions. Reform that improves utilities’ financial health could therefore open LMIC markets that private capital currently avoids.
Feasibility: Medium. Although utility best practices—such as approaches to reducing commercial and technical losses of electricity and improving revenue collection—are well understood, LMIC utilities and regulators have not widely adopted them.81 The gap persists in part because governments face sustained pressure to keep electricity prices low, and utilities are frequently used as instruments of social policy rather than run as commercial entities.82 We think education and engagement can shift utilities toward more sustainable models; however, education alone is unlikely to shift tariff policy, as it is more politically exposed than loss reduction and governance improvements. That said, we believe philanthropic support for research, education, and technical assistance can feasibly drive progress on tariff policy, loss reduction, and governance improvements. This work will require in-country engagement, but many existing efforts—especially education-focused ones—operate at the regional level and engage with utilities across multiple countries at once. We are more uncertain about durability, since reforms adopted under one government can be reversed by the next.83
Funding need: High. Funders do not always see improving utility operations as a lever to reduce emissions in LMICs, and as a result, it receives less support than we think it should. Specifically, we estimate with low confidence that utility reform in LMICs received roughly $5 million in philanthropic funding in FY2023 and $8 million in FY2024.84 Compared to other sub-strategies we assessed, improving utility operations has relatively low funding. We think additional philanthropic funding could be leveraged at the regional level to support education and the implementation of best practices. We also think the dismantling of USAID in 2025, which provided utility technical assistance, among other support, has left an additional funding gap that philanthropy could fill.85
Implementing Grid Planning and Reliability Best Practices
- Scale: 🟢🟢🟢 High
- Feasibility: 🟡🟡⚪️ Medium
- Funding need: 🟢🟢🟢 High
Scale: High. An unreliable or poorly planned grid lowers offtakers' willingness to pay and pushes them toward costly backup diesel generation, which further erodes the utility's revenue base and directly raises emissions.86 As a result, the level of investment risk increases, pushing investors out. Additionally, modeling conducted during the planning process can shape whether grid buildout supports the deployment of clean electricity or fossil fuel resources. Well-planned grids can be the difference between attracting investment and generating more risk.
Feasibility: Medium. Utilities and grid regulators require models for monitoring, forecasting, and long-term planning. Existing commercial tools are expensive and require specialized technical training to operate, leaving many LMICs without practical access to them.87 Developers, research institutions, and non-governmental organizations (NGOs) are beginning to build open-source alternatives that LMICs can access, but many LMICs still fail to own and run these models on their own. A large portion of LMIC energy modeling is currently led by external consultants and foreign governments, which means the results often neither draw on local knowledge nor build domestic capacity.88 Philanthropy can help fund tool development, dataset creation, and regional training. Putting these tools to use, however, requires in-country engagement and training, which is feasible but challenging to deliver from a regional platform. Even so, we think there are entry points at different funding levels, from supporting a single utility's planning process to building tools intended for wider use.
Funding need: High. Grid planning has not been a major focus of philanthropy in LMICs and requires additional funding and support. We estimate this sub-strategy received roughly $4 million per year in philanthropic funding in both FY2023 and FY2024, the lowest total across the sub-strategies we assessed.89 Some organizations work in this area, including through dedicated grid modeling programs, but funding is not at the scale of the challenge. To support the number of LMIC utilities and regulators that need planning capability, we think philanthropic funding could grow by at least four times and reach the scale of funding other sub-strategies currently receive. We also think this is an area where smaller grants can have leverage despite the high funding need. Smaller grants can support the development of software, datasets, or training programs that many countries can build on and leverage.
-----
68 We rate this feasibility for “supporting electricity policies and regulations that spur clean energy deployment” as low not because the impact or potential is low, but because it is challenging to pass policies when taking a regional or multi-country approach compared to strategies focused on one country. Our regional and multi-country approach is not well suited to support the in-depth country strategy needed to successfully support the passage and implementation of influential policies.
69 “Support for capacity and institution-building is vital to improve energy sector governance, and enhance clean energy knowledge and relevant skills.” IEA & IFC, 2023
70 “Power Purchase Agreements (PPAs) with Independent Power Producers (IPPs) were conducted through nontransparent, non-competitive processes.” World Bank, 2026
71 “We present an expanded set of energy planning considerations and related modelling methodologies that can better capture the diverse risks LMICs often contend with when building energy systems in contemporary conditions. We propose three ways of taking this forward – i) focusing on making data and modelling available, based on open science principles; ii) prioritising context-specific support for modelling in countries with lower planning capacity; and iii) developing and expanding networks of practice that support LMIC modelling practitioners.” Daly et al., 2026
72 As an example, G-PST convenes system operators, regulators, and research institutions through regional partners including the ASEAN Centre for Energy, the Renewables in Latin America and the Caribbean initiative, and the Council for Scientific and Industrial Research in Southern Africa. G-PST, 2025
73 “Generally, a lack of high-quality, accurate data is a critical obstacle in designing modelling approaches, especially in LMICs.” Fuchs et al., 2024
74 This included key funders such as the IKEA Foundations, ClimateWorks Foundation, Growald Climate Fund, Bloomberg Philanthropies, and Sequoia Climate Foundation, as well as grant amounts that were anonymous or could not be attributed to one funder.
75 “Another prominent barrier to increased investment in these markets is buildout of a pipeline of large, predictable and bankable projects, which are a critical signal to attract investors, especially large and international ones who generally enter markets only if there is enough preparation expected growth to cover for the transaction costs.” IEA, 2024(b)
76 “Project aggregation platforms and securitisation vehicles can overcome the asymmetry between the relatively small size of most energy transition projects in EMDEs and the relatively large minimum investment size that major institutional investors require. These platforms can pool large numbers of smaller projects and thereby create standardised investment-grade multi-asset portfolios, reducing transaction costs, diversifying risk and attracting interest from institutional investors.” IEA & IFC, 2023

77 This includes funders such as Bloomberg Philanthropies, Rockefeller Foundation, Quadrature Climate Foundation, Growald Climate Fund, The Children's Investment Fund Foundation, MacArthur Foundation, and the IKEA Foundation
78 Multiple reports have found funding from HICs to LMICs for development and aid has decreased. OECD, 2026; Pew Research Center, 2026; MSC, 2025.
79 “chronic poor financial performance of electricity utilities is pervasive in the developing world—resulting from underpricing, excessive losses, and bill collection failure—and has for decades been a main driver of investment shortfalls, under-maintenance of infrastructure, power shortages, poor quality of supply.” World Bank, 2020
80 “Utilities that do not recover costs present greater risks to investors, will face higher financing costs, and will struggle to attract financing at the scale required to achieve the energy transition and universal access.” World Bank, 2024(a)
Feed-in tariffs refer to the fixed per-unit price a government guarantees to a generator to supply electricity to the grid. This is similar to a PPA with the difference being a feed-in tariff goes through the government while a PPA is a private mechanism.
81 “Twenty-seven utilities included in the UPBEAT database could achieve cost recovery by improving their collections and reducing their system losses and costs of supply to below benchmark levels. This would require utilities to implement efficient investment plans and programs to sustainably reduce technical and commercial losses, as well as revenue protection plans to improve customer billing and payment collection.” World Bank, 2024(a)
82 “Political pressure to provide subsidized or free power to certain groups of consumers (e.g. agriculture sector) also undermine the cost recovery effort” World Bank, 2020
83 “Another cause of decline in cost recovery is a reversal of tariff reforms or stalling of tariff increases due to sociopolitical pressure.” World Bank, 2020
84 This includes funders such as ClimateWorks Foundation, Hewlett Foundation, Quadrature Climate Foundation, European Climate Foundation, Rockefeller Foundation, and IKEA Foundation.
85 USEA, n.d.
86 “The relationship between payment and supply is completely broken: customers no longer see a reason to pay their bills because power is unreliable or intermittent, and utilities no longer see customers as essential for revenue (they rely on government bailouts).” World Bank, 2026. On the emissions cost of backup diesel self-generation, see IFC, 2019.
87 “While simulation tools have gained prominence in providing transition insights to modelling the energy paradigm of developed countries, their developing country counterparts have yet to gain a clear transition pathway. This could be due to the cost of commercial tools,technical know-how, and the complex attributes and underdevelopment of developing countries’ energy systems transition paradigm.” Shari et al., 2025
88 “It is often the case that modellers from HICs lead or support modelling projects in LMICs, given their comparatively longer experience. [...] This external leadership has been criticised for lacking context-specific knowledge and sensitivity and for neglecting the different socio-economic dynamics of countries.” Fuchs et al., 2024
89 This includes funders such as the Rockefeller Foundation, IKEA Foundation, and Quadrature Climate Foundation.
Theory of Change for Philanthropic Engagement
We developed a high-level theory of change for how philanthropic actors can reduce emissions by derisking clean electricity investments in LMICs by focusing on barriers that hold back financing in LMICs. Theories of change enable us to better understand the pathways of influence, the likelihood of each pathway, and the avenues of greatest impact for philanthropic and civil society efforts.
We evaluate the main assumptions underlying the theory of change and rate our certainty in each as low, medium, or high.90 Our assessment is based on both primary and secondary evidence, as well as our general impression of the assumption’s plausibility.

Evaluating Key Assumptions
- Improved grid planning, utility operations, and management will lead to more deployment of clean electricity (medium certainty)
When grid planning is based on high-quality data and well-designed tools, grid decision-makers can make more informed decisions on what should get built. Rational plans, in turn, give investors greater confidence that a clean energy market will succeed.91 Similarly, higher-quality data and more advanced forecasting tools allow grid operators to integrate more clean electricity.92 Without advanced forecasting, grid operators will have a harder time anticipating how VRE output will meet demand, and as a result, may have to hold more capacity in reserve and take on less clean generation than they otherwise could.93 Many LMICs also lack a clear understanding of the state of their grids, making reliable operation more challenging and potentially complicating VRE integration. Digitizing grid infrastructure and integrating smart metering can provide the necessary information to operate grids more reliably, and can therefore increase investor confidence in the grid.94 Finally, utilities that cut system losses and improve revenue collection can move closer to cost recovery.95 As a result, improved financial health will allow utilities to be better offtakers of planned clean electricity projects, and could lower the risk for investors and attract more financing.96
That said, better models, data, and operations will not force grid decision-makers and operators to act a certain way and, as a result, they may not decide to deploy more clean electricity, especially if it is contrary to political goals such as those resulting from pressure to prevent near-term electricity price increases. Capacity expansion models identify the least-cost mix among many resources, including fossil fuel generators, and may support new gas capacity. Improved grid operations and better-run utilities will also allow fossil fuel resources, in addition to clean electricity resources, to more easily integrate onto the grid. However, VRE is a low-cost option in many LMICs, so we expect most well-informed and advanced models to prioritize it. As such, we think improvements to grid operations and management will disproportionately attract further investment into clean electricity.97
- Creating clean electricity project aggregation facilities will increase investment (medium certainty)
Aggregation facilities can lower the risk investors face by spreading their exposure across multiple projects.98 These mechanisms can also give investors access to grid infrastructure projects they could not reach otherwise.99 Additionally, investors without a regional or in-country presence have a harder time understanding and evaluating an LMIC market, which can lead them to perceive higher risks.100 We think a “one-stop shop” driven by a team with more local expertise can help clean electricity projects in an aggregation facility draw more investor attention than they would on their own.101 Furthermore, successful aggregation facilities that educate investors on market conditions and best practices could help attract new investors into LMIC markets or help those investors establish aggregation facilities of their own. Altogether, we think project aggregation facilities can lead to more clean electricity deployed in LMICs by lowering the risk investors face and drawing more investor attention to clean electricity projects.
However, despite reduced risk and easier access to projects, building new project aggregation facilities may not attract significant additional investment. Regional risks—such as currency exposure, weak contract enforcement, and offtaker non-payment—may be too high to attract new investors, who may view the aggregation facility as a collection of risky projects. Aggregation facilities only lower project-specific risks that are unlikely to occur across multiple projects at the same time, such as a construction delay, a land dispute, or equipment that underperforms at a single site.102 Other risks that keep investors out of LMIC markets, such as an unreliable offtaker or a change in regulation, are more likely to apply to every project in that market at the same time. While spreading investment across countries can address part of this problem, an aggregation facility is unlikely to offer enough diversity to avoid country-level risks.103 Some investors will also wait for several examples of successful investments in an LMIC before considering the risk low enough to enter.104 As a result, aggregation facilities may only attract private finance by using blended capital and creative financing mechanisms—such as first-loss capital—to lower the risk and the barrier to entry.105
Altogether, we think that project aggregation facilities can lower the risk investors face and attract new financing for clean electricity projects. We hold this assumption with medium certainty, since aggregation is a well-established risk-reduction mechanism and facilities operating in LMIC markets today show the structure can be built. We are less certain, however, that any one facility can spread the risks that keep investors out of an LMIC market, since those risks are largely shared. Other sub-strategies discussed in this report will still be necessary to help derisk LMIC markets, and will possibly dictate the level of capital that flows to project aggregation facilities.
-----
90 We describe our certainty as low/medium/high to increase readability and avoid false precision. Since these terms can be interpreted differently, we use rough heuristics to define them as percentage likelihoods the assumption is, on average, correct. Low = 0-60%, medium = 60-80%, high = 80-100%
91 “Other participants […] also cautioned that external modellers often lacked specific contextual knowledge to use appropriate assumptions and data, as well as navigate stakeholder expectations. To address this, participants emphasised the importance of involving local experts in the modelling process in order to enhance the credibility of inputs and outputs, particularly for policymakers.” Fuchs et al., 2024
92 “data foundations support improved forecasting, grid stability, optimised operations, modelling, incentive design and alignment with regulatory goals, facilitating a seamless transition to a sustainable energy future.” IEA, 2024(c)
93 “The VRE integration challenges for grid operators and planners stem from both the inherent characteristics of VRE resources (i.e. variable with limited predictability; site-specific) and the characteristics of the system into which they need to be integrated.” ESMAP, 2019(a)
“Due to the variable nature of wind and solar PV generation, improved forecasting can support the secure and efficient operation of the power system and minimise the need for balancing actions.” IEA, 2024(c)
94 “Much greater granularity is required for spatial analysis to identify weaknesses and improve stability. Open-source data sets and tools can support electricity access planning and help to target loss-reduction measures.” IEA, 2024(a)
“Smart grid technologies such as advanced metering infrastructure (AMI), smart meters, and remote sensors enable real-time monitoring, faster fault detection, and quicker restoration of service.” Phillips et al., 2025
95 “Twenty-seven utilities included in the UPBEAT database could achieve cost recovery by improving their collections and reducing their system losses and costs of supply to below benchmark levels.” World Bank, 2024(a)
96 “Utilities that do not recover costs present greater risks to investors, will face higher financing costs, and will struggle to attract financing at the scale required to achieve the energy transition and universal access.” World Bank, 2024(a)
On how widespread the problem is: World Bank, 2020.
97 “There are signs in some markets of very competitively priced solar panels, typically imported from China, making their way into EMDE.” IEA, 2025(c)
98 “While de-risking can occur at the project level, portfolio solutions are widely recognized as the most effective solution to mobilize capital in EMDEs. The diversification they offer significantly enhances risk mitigation, providing robust strategies to address various types of risks. Grouping projects as part of portfolios – also referred to as platforms – allows for the attraction of more international players looking for geographical, resource and currency diversification. It also encourages improved financing terms by reducing the cost of capital.” WEF, 2024
99 “Infrastructure investment trusts (InvITs) offer another example of an innovative instrument. These are pooled investment vehicles regulated by the Securities and Exchange Board of India that give investors exposure to infrastructure assets. The main goal of InvITs is to promote India’s infrastructure sector by encouraging individuals or institutions to invest in assets that they would not otherwise have direct access to. [...] There are a number of variations worldwide that aim to achieve the same objective: attracting investors to operating infrastructure assets and allowing developers to free up capital to continue developing new ones.” IEA & IFC, 2023

100 “Another prominent barrier to increased investment in these markets is buildout of a pipeline of large, predictable and bankable projects, which are a critical signal to attract investors, especially large and international ones who generally enter markets only if there is enough preparation expected growth to cover for the transaction costs.” IEA, 2024(b)
101 “local developers can find it more difficult to access finance from international sources.” AfDB, 2020
102 Project-level risks such as permitting delays, land rights disputes, and errors in resource measurement are described as specific to projects, in contrast to power market, counterparty, political, and currency risks, which apply across a market. See pages 15 and 16. SEI, 2023
103 “In addition, with global markets becoming increasingly correlated, particularly during economic downturns, country risk appears not to be diversifiable (Damodaran, 2021). This may help explain the reality of risk premiums that are observed in developing countries compared to developed countries, even for diversified investors.” SEI, 2023
104 Private capital may not reach projects in LMICs due to “unattractive risk-return profiles in unproven markets.” Prasad et al., 2022
105 Blended finance is defined as a structuring approach that uses public or philanthropic capital to attract private investment, and first-loss positions, guarantees, and tenor extension are listed among the ways development partners engage with renewable energy project finance structures. See page 5 and Figure 3 on page 17. SEI, 2023
Is There Room for More Funding?
We think there is significant room for more funding to support derisking clean electricity investments in LMICs. Across our four prioritized sub-strategies, we calculate with low confidence that $39 million in philanthropic funding was directed toward this work in 2024. For context, ClimateWorks Foundation calculated that LMICs received roughly $940 million in direct foundation funding for climate change mitigation in 2024, of which we estimate roughly $212 million went to clean electricity.106 In other words, our four prioritized sub-strategies may have received only 4% of total LMIC philanthropic climate funding, and 18% of total philanthropic funding for clean electricity in LMICs.107 Based on their share of electricity emissions in 2025, LMICs received 5 cents per ton of CO2e in philanthropic funding, while the U.S. received 22 cents per ton of CO2e.108 Although these figures are estimates derived from applied percentages rather than direct measurement, they suggest that limited philanthropic funding currently supports derisking clean electricity investment in LMICs.
In order to increase total investments into LMICs by $1 trillion a year and successfully reduce emissions, philanthropic support for derisking clean electricity investments will need to increase.109 To date, funders such as the Rockefeller Foundation, IKEA Foundation, Quadrature Climate Foundation, and Bloomberg Philanthropies have been the largest supporters of this work.110 For funding to increase, new funders will need to enter the mix, and existing funders will have to scale up their contributions. Given the size of these funders and the size of the funding gap, it might seem that only large institutions can contribute meaningfully. We believe, however, that philanthropic support is not limited to funders of that size. Specifically, grid planning, dataset development, and utility education can absorb smaller grants productively.111
Our impression is that regional work to derisk clean electricity investments in LMICs receives less philanthropic support than country-specific work. One expert who works directly with HIC government agencies shared that these agencies strongly prefer funding country-specific programs over regional efforts, and the grants we reviewed for this report show a similar pattern.112 We hold this impression with low confidence, as it rests on a small number of observations. Many of the barriers described in this report are shared across countries outside of the small group of LMICs where funders concentrate their country-specific programs, and are therefore unlikely to attract dedicated support of their own. A regional approach is therefore critical to reach them, and complements the country prioritization approach that resulted in our India and Indonesia strategies (see our prioritization brief), as well as the country-specific approaches of other funders.
Currently, there is a growing gap in support for derisking clean electricity investments in LMICs and therefore a greater need for philanthropic funding. HIC governments, multilateral development banks (MDBs), and development finance institutions (DFIs) all support work targeted at removing many of the barriers discussed in this report. Funding from HICs to LMICs has been declining, leaving a growing gap at a time when it needs to grow substantially.113 For example, USAID's dismantling in 2025 removed a critical source of technical assistance. While MDBs and DFIs will likely continue to provide growing support, we think philanthropic dollars will be crucial to closing this gap.
-----
106 LMIC funding combines Africa (8%), Asia and Oceania (6%), Latin America (4%), India (4%), Brazil (3%), and Indonesia (1%). We calculated LMIC funding from these percentages. These regions include some HICs, such as Australia, Japan, New Zealand, Singapore, and South Korea, so we expect the total percentage to be slightly smaller. For comparison, the same report found that Europe received $890 million (USD), or 24%, and the U.S. received $1.7 billion, or 47%, of foundation funding in 2024. See "Figure 8. Share of foundation funding to a single geography or country, 2024, USD millions," ClimateWorks Foundation, 2026
To see how we calculated our estimate of roughly $212 million, please see footnote 114.
107 ClimateWorks Foundation, 2026 defines clean electricity philanthropic funding as funding that went to advanced renewables, clean energy access, energy transition, power system reform, transition minerals, and other clean electricity. We reached 18% by dividing our estimation of $39 million for the four prioritized sub-strategies by our estimation of $212 million going to clean electricity in LMICs, using ClimateWorks Foundation, 2026 data.
108 ClimateWorks Foundation, 2026 found that 22.5% ($840 million) of the $3,740 million in known global climate mitigation foundation funding in 2024 went to clean electricity. We then applied that percentage to the funding that went to LMICs ($940 million) and to the U.S. ($1.7 billion), which assumes both regions allocate a similar share of their climate funding to clean electricity as the global rate. We have not verified that assumption. Applying it gives $211.5 million for LMICs and $382.5 million for the U.S. We then divided each figure by 2025 electricity generation emissions for LMICs (4.11 billion tons of CO2) and the U.S. (1.74 billion tons of CO2). Emissions data was calculated using Our World in Data, 2026(a) and our calculations can be found here.
109 “1) CPI & GFANZ, 2025 finds that CapEx for clean energy infrastructure in EMDEs will need to grow from $380 billion USD in 2025 to $1,300 billion USD a year by 2035 to stay on track with net zero by 2050 targets. These numbers exclude China. 2)IEA & IFC, 2023 finds that EMDE clean energy investments will have to grow from $262 billion USD in 2022 to $1,370 to $1,860 billion USD per year by 2035. This similarly excludes China. 3) GRA, 2025 finds that to stay on track with IRENA’s 1.5℃ goal and triple the deployment of renewables, financing for solar and wind projects in EMDEs would have to increase from $109 billion USD in 2024 to $3,768 billion USD between 2024 and 2030, or $630 billion USD per year.”
110 Other funders such as the Growald Climate Fund, Pisces Foundation, Bezos Earth Fund, ClimateWorks Foundation, Sequoia Climate Foundation, SED Fund, MacArthur Foundation, the Children's Investment Fund Foundation, and others have also supported derisking clean electricity work in LMICs.
111 While certain grants, such as developing and disseminating new open-source models, may require upwards of $1 million, we have seen smaller grants fund a discrete tool, dataset, or training program, or add to work a larger grantmaker is already supporting.
112 This is based on an interview with an expert who works directly with HIC government agencies and shared their experience. Countries will more often work directly with countries that they have a relationship with or see a strategic benefit.
113 Multiple reports have found funding from HICs to LMICs for development and aid has decreased. OECD, 2026 finds that Development Assistance Committee (DAC) members reduced their funding for development by 23% between 2024 and 2025; Pew Research Center, 2026 finds that the US spent $26 billion less on foreign assistance in 2025 compared to 2024, and has only spent $7 billion in 2026 with two more months left in the fiscal year; Our World in Data, 2025(b); MSC, 2025.
Are There Major Co-Benefits or Potential Risks?
Co-Benefits
- Increase in electricity access: Portions of LMICs still have relatively low rates of access to electricity, with sub-Saharan Africa accounting for around 80% of people without access.114 Making it easier to finance and deploy clean electricity in LMICs would allow more communities to gain electricity access for the first time.
- Economic growth and development: Unreliable supply carries economic costs. Firms exposed to power outages show around 9% lower average productivity than their counterparts, and unreliable supply also pushes offtakers toward costly backup diesel generation.115 Higher-quality electricity, combined with greater access, will allow LMIC communities and industries to operate more efficiently and grow their economies faster. Finally, building modern clean grids could also support job development in LMICs across critical sectors, such as infrastructure and research.
- Greater short-term energy security: When conflicts or financial crises hit, LMICs are at the whim of volatile fossil fuel prices and limited supply, which can drive up the cost of electricity.116 Expanded access to clean electricity would likely increase energy security in LMICs and make them more resilient to fossil fuel price shocks. LMICs, however, may not have complete energy security in the long run because they may still rely on other countries for clean electricity infrastructure.
- Improved grid reliability: High rates of VRE make it challenging for grid operators to manage a grid.117 This is because VRE power output fluctuates throughout the day, and its peak production does not line up with demand.118 However, with improved grid planning and management practices, LMICs can help prevent many of these reliability challenges as they quickly integrate large amounts of existing off-grid VRE and new VRE projects onto the grid. These best practices will in turn build reliable grids that meet offtakers’ demand with consistent, clean electricity.
Potential Risks
- Electricity affordability: Expanding clean electricity and the needed grid infrastructure is capital-intensive, with most costs incurred upfront. Utilities financing this buildout must recover those costs and may pass them on to consumers through tariffs. Costs may be even greater when clean electricity replaces fossil generators far from the end of their operating lives, since consumers still have to pay off the remaining value of those assets even after they stop running. LMIC electricity is already unaffordable for many offtakers, and very few LMIC utilities recover their costs today, so there is little headroom to absorb higher prices.119 That said, we think the political environment will strongly incentivize utilities to keep electricity costs from rising. Additionally, the rapidly falling cost of clean electricity generation means utilities could lower generation costs if countries make the necessary complementary investments in grid infrastructure and planning.
- Just transition and social resistance: Some LMICs covered by this strategy may have large fossil fuel industries and workforces that depend on them. Where that is the case, faster clean electricity deployment could displace jobs and public revenue, and affected communities may resist the transition. The risk does not apply in every country we cover, and because this strategy works at a regional level rather than on in-country policy, we expect our influence on it to be limited.
-----
114 “While regions such as developing Asia and Latin America are close to universal access to electricity, substantial gaps persist in many countries in sub-Saharan Africa. This region accounts for around 80% of people without electricity access.” IEA, 2025(b)
115 “power outages negatively and significantly affect firm-level revenue-based total factor productivity, with a 9 percent lower unconditional average productivity for exposed firms compared to nonexposed firms." World Bank, 2023

116 1)“Higher energy prices are also increasing food insecurity in many developing economies, with the heaviest burden falling on poorer households where a larger share of income is spent on energy and food. Some 75 million people who recently gained access to electricity are likely to lose the ability to pay for it, meaning that for the first time since we started tracking it, the total number of people worldwide without electricity access has started to rise.” IEA, 2022(a)
2)”High fuel prices account for 90% of the rise in the average costs of electricity generation worldwide, natural gas alone for more than 50%. The costs of renewables and carbon dioxide have played only a marginal role.” IEA, 2022(b)
117 “Clean energy gains risk becoming a source of fragility rather than resilience.” Phillips et al., 2025
118 “The VRE integration challenges for grid operators and planners stem from both the inherent characteristics of VRE resources (i.e. variable with limited predictability; site-specific) and the characteristics of the system into which they need to be integrated.” ESMAP, 2019(a)
119 A new World Bank database that tracks the financial and operational performance of more than 180 utilities in over 90 countries shows that fewer than 40 percent of utilities are able to collect enough revenue to meet their annual operating and debt service costs the bare minimum for financial sustainability. This situation is especially bleak for utilities in [LMICs], where high costs of supply, low tariffs, operational inefficiency, and poor sector planning and procurement often create persistent cycles of underperformance.” World Bank, 2024(b)
Key Uncertainties and Open Questions
- How much demand and emissions will grow by 2050: We searched for sources that project electricity demand and grid emissions in LMICs out to 2050 and found few. Projections at this level of aggregation are also difficult to construct, because the LMIC grouping spans many countries that could follow very different demand and generation pathways, and small differences in assumed carbon intensity compound over 25 years. The IEA's 2025 World Energy Outlook runs its electricity production projections to 2050, but most of its granular data, and most other modeling we found, is centered on 2030.120 We could not find specific modeling of electricity emissions in LMICs in 2050, so we estimated emissions using projected electricity generation from the IEA’s 2025 World Energy Outlook dataset. We have low confidence in these numbers, and we are still uncertain what demand and emissions will look like in 2050 without additional action.
- The role and impact of other countries, such as China, expanding their presence in LMICs: Earlier in the report, we noted that HIC funding to support LMICs has been declining. Nevertheless, several countries remain highly interested in making investments in LMICs, particularly in supply chain development. China, for example, has invested about $1.5 trillion between 2013 and mid-2026 through its Belt and Road Initiative.121 While 2026 investments have skewed clean, China has continued to invest in fossil fuels in LMICs as well.122 Most of these investments have not addressed grid challenges. We are uncertain whether this interest from foreign countries will translate into greater support for derisking clean electricity in LMICs and attracting additional investment.
- The impact of grid development and improved management on fossil fuel usage: Since many countries are looking to meet quickly growing demand, they may turn to fossil fuel resources in addition to clean electricity sources. Several sub-strategies discussed in this report focus on removing risks and barriers at the grid and electricity market level. Many of these interventions’ benefits are technology-neutral and could theoretically lower the risk of making investments in fossil fuel resources. We are uncertain how much these sub-strategies will increase fossil fuel deployment. We think, however, that they will benefit clean electricity resources more widely, because solar and wind are cost-competitive in many regions even under the IEA's most cautious policy assumptions, and because fossil fuel expansion is constrained by high and volatile prices and energy security concerns.123

- The role of recent conflicts and their impacts on energy security: Recent conflicts in Ukraine and Iran have upended the global energy market. Many countries are feeling the pain of high prices and low supply, which has motivated them to consider moving away from foreign sources of fossil fuels.124 As time progresses, we are uncertain how much conflict and energy security concerns more broadly will push LMICs toward integrating more clean electricity.
-----
120 The IEA has conducted modeling going out 2030 (IEA, 2024(a)) and 2050 (IEA, 2025(a)) on projected LMIC on energy production.
121 “Cumulatively, Chinese BRI engagement has reached USD 1.539 trillion since 2013 of which USD 926 billion in construction and USD 614 billion in investments.” Green Finance & Development Center, 2026
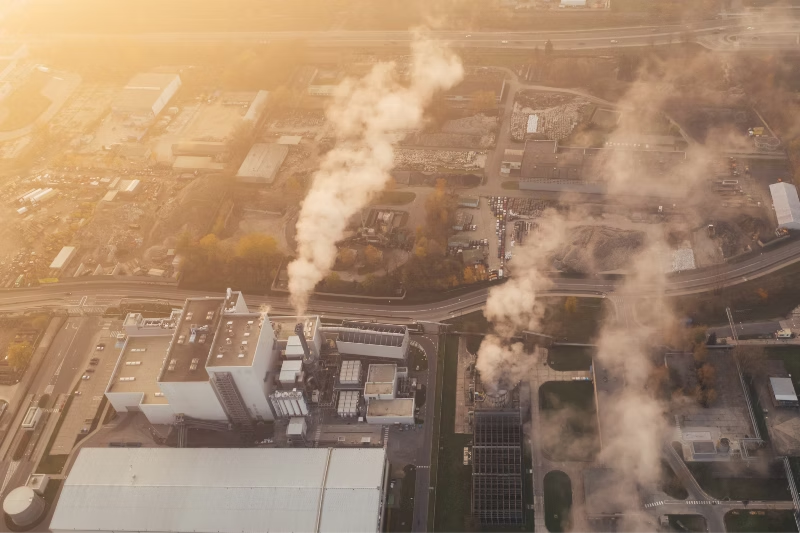
122 “56% of China’s energy engagement was green (in the first half of 2026) – a new record both in absolute and in relative terms [...] More than 20 GW of green electricity projects confirmed through investment and construction – more than in all of 2025.” & “A Chinese company agreed to build a new 660 MW coal fired power plant in Zambia – approvals are pending.” Green Finance & Development Center, 2026
123 “Electricity demand rises in all countries and regions, with the strongest growth in India and Indonesia, but the push for a much more electrified energy system does not gain broad momentum in the (current policy scenarios) CPS. Solar photovoltaics (PV) and wind are cost competitive in many regions, but deployment faces integration challenges that slow further growth.” IEA, 2025(d)
124 ”High fuel prices account for 90% of the rise in the average costs of electricity generation worldwide, natural gas alone for more than 50%. The costs of renewables and carbon dioxide have played only a marginal role.” IEA, 2022(b); “Oil and natural gas prices have experienced significant volatility since the war [in Iran] began. In the wake of the largest oil supply disruption in history, Brent futures – the global benchmark for crude prices – rose steeply, peaking at more than 60% above pre-conflict levels in late April.” IEA, 2026
Acknowledgments
Diego Garrison researched and wrote this report, and Kim Huynh managed and oversaw the research. Dan Stein provided valuable feedback on the report and model drafts. This work has benefited greatly from feedback provided by a variety of external advisors, experts, and reviewers throughout the research process. Giving Green is grateful for those who shared their time, experience, and ideas. We would especially like to acknowledge the principal reviewers, Dr. Kartikeya Singh, Director of Collective Impact, Growald Climate Fund, and Shunondo Basu, Director of Energy Technology and Innovation, Power Team, Rockefeller Foundation, for providing a deep review of this strategy report during its final stages of development. All opinions remain those of Giving Green alone, and any remaining errors are our own.
Support Our Work
Giving Green Fund
One fund. Global impact. One hundred percent of your gift supports a portfolio of high-impact climate organizations, vetted by our research.
Best for:
Donors who want the simplest way to impact multiple climate solutions.
Top Climate Nonprofits
Meet the organizations on Giving Green’s list of high-impact nonprofits working to decarbonize our future, identified through our rigorous research.
Best for:
Donors who want to give directly and independently.
Support Our Work
We thoroughly research climate initiatives so you can give with confidence. For every $1 we receive, our work unlocks another $25.90 for effective climate solutions.
Best for:
Donors who want to amplify their impact through research.

.webp)


.webp)


%20(1).png)
.webp)
.webp)
.webp)


.webp)


.webp)
.webp)
.webp)
.webp)


.webp)


.webp)
.webp)

.webp)


.webp)


%20(1).webp)


.webp)

.webp)
.webp)
%20(1).webp)


.webp)

.webp)

.webp)
.webp)


.webp)

.webp)
.webp)


.webp)
.webp)